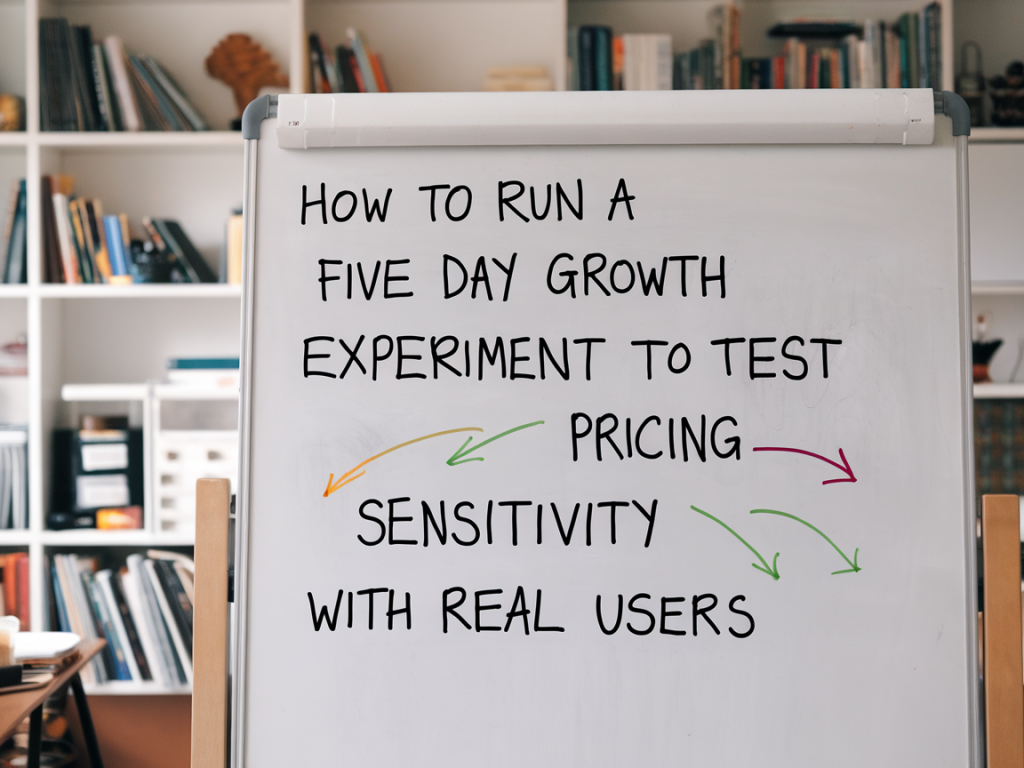
I run short, focused growth experiments whenever I need a fast, evidence-based answer to a product question. One of the most useful—and surprisingly underused—experiments is a five-day pricing sensitivity test with real users. In five days you can validate whether small price changes affect conversions, identify price tiers that resonate, and gather qualitative signals that inform a longer-term pricing strategy.
Below I walk through the exact playbook I use: the hypothesis framing, tactical setup, the day-by-day plan, what to measure, and how to interpret results. This is practical, no-fluff guidance you can run with your existing funnel and minimal engineering work.
Why five days?
Five days hits a sweet spot: it’s long enough to accumulate meaningful sample size and short enough to avoid complicated long-running artifacts (seasonality, campaign shifts). It forces discipline: you pick one hypothesis, limit variations, and focus on clean signals. For many SaaS or digital products, five days gives reliable directional insight—especially if you target active traffic sources like trial signups, paid acquisition, or an engaged email list.
Start with a clear hypothesis
Every experiment needs a crisp hypothesis. Examples I've used:
- Raising monthly price by 10% will reduce conversions by less than 5%.
- Introducing a lower-priced entry tier will increase trial signups by >15% and not cannibalize current plan upgrades.
- Adding a discount countdown increases conversion rate on the annual plan by >10%.
State your hypothesis in terms of measurable metrics (conversion rate, revenue per visitor, trial-to-paid). The goal is not absolute proof, but directional evidence you can act on.
Choose the right metric mix
Pick a primary metric and one or two secondary metrics. For pricing experiments I usually track:
- Primary: Conversion rate (visitor → paid, or trial → paid) for the tested flow.
- Secondary: Revenue per visitor (RPV), average order value (AOV), churn signal (if available), and qualitative feedback (survey responses).
Why RPV? A price cut that improves conversion but kills RPV is not necessarily a win. Conversely, a slight drop in conversion that increases revenue per conversion can be acceptable.
Minimal technical setup
Keep the engineering friction low. I usually implement tests with one of these approaches depending on traffic and resources:
- Feature flag / A/B test tool (Optimizely, VWO, Google Optimize) to swap pricing text and CTA flows.
- Server-side flag to present different price points to a percentage of users. Useful for billing-sensitive platforms.
- Two landing pages with distinct pricing and an experiment parameter in the URL; route traffic via an ad campaign or email.
- For early-stage founders: manual landing page + gated checkout link (Stripe Checkout with a specific price ID) split with a simple redirect rule.
Track with Google Analytics (events + goals), your product analytics (Amplitude, Mixpanel), and revenue data from Stripe/Chargebee. Add an in-flow micro-survey (Typeform, Hotjar) after conversion to capture price sentiment.
Audience and traffic considerations
You want traffic that's representative of your decision-makers. Avoid relying solely on organic blog readers if they aren't buyer intent. I recommend:
- Paid ads targeted to the buyer persona for consistent volume.
- Email segments of warm leads or recent trial starters.
- In-product prompts for active users (if testing upgrades).
Allocate at least 3–4x more traffic than your usual conversion sample to get useful significance in five days. If you can't reach volume, extend duration rather than testing too many variations.
Experiment design: keep it simple
Limit variables. Test one price change at a time and avoid coupling it with copy or feature changes—unless your hypothesis explicitly tests packaging + price. Common setups:
- Control vs. single variation: e.g., $29/month (control) vs $32/month (variation).
- Entry pricing test: $19 vs $15 entry tier to measure top-of-funnel lift and upgrade behavior.
- Discount framing: 10% off for 48 hours vs no discount.
If you must test multiple levels, use a staged approach: run the five-day test for the most plausible change, then iterate with the next level.
Five-day playbook
Here’s the hands-on schedule I follow. It assumes you have tracking and two variants ready on day one.
- Day 0 (prep): Finalize hypothesis, set up experiment, QA tracking, ensure billing links point to correct price IDs. Prepare a short in-flow survey for paid users.
- Day 1 (launch): Send traffic and monitor initial data. Check for technical errors, ensure events fire, and verify that revenue is recorded correctly.
- Day 2 (stabilize): Watch for outliers, look at early behavioral signals (drop-off on checkout, cart abandonment). Start collecting qualitative responses from buyers.
- Day 3 (midpoint analysis): Calculate preliminary conversion and RPV. If one variant is failing catastrophically (e.g., checkout broken), pause. Otherwise, let it run.
- Day 4 (signal refinement): Segment by source and user intent. Are paid channels reacting differently than email? Start looking at cohort behavior (new vs returning).
- Day 5 (wrap & export data): Stop the experiment traffic, export analytics and revenue, collect survey responses, and prepare for analysis.
Simple analysis framework
I use this checklist to interpret results:
- Compare conversion rate between control and variation with confidence intervals (or Bayesian probability if you prefer).
- Compare revenue per visitor: did the variation increase or decrease RPV?
- Look at upgrade and churn signals for early warning signs.
- Analyze segment differences—what works for SMBs might fail for freelancers.
- Read qualitative feedback: are objections price-related, or feature/value-related?
Sample quick table I export to speed up decisions:
| Variant | Visitors | Conversions | Conversion Rate | Revenue | RPV |
|---|---|---|---|---|---|
| Control | 4,200 | 210 | 5.0% | $6,300 | $1.50 |
| Variation (+10%) | 4,100 | 198 | 4.8% | $7,020 | $1.71 |
Interpreting noisy results
Often five days gives directional, not definitive, results. If you see a clear lift in RPV with a minimal conversion drop, that’s actionable. If results are mixed, use the data to design a follow-up test: longer duration, different segment, or a different price point.
Common pitfalls to avoid
- Testing without reliable revenue tracking—if Stripe events aren’t recorded you’ll be flying blind.
- Changing multiple variables at once (price + new feature messaging).
- Using low-quality traffic that doesn’t reflect buyers.
- Relying on statistical significance from tiny samples—extend the test instead.
Tools I lean on
For quick experiments I typically use:
- Stripe Checkout / Price IDs (fast and reliable for billing).
- Google Optimize or a simple A/B redirect for landing pages.
- Mixpanel or Amplitude for funnel event tracking.
- Google Analytics for traffic segmentation and basic goals.
- Typeform or Hotjar for short in-flow surveys.
Run a five-day pricing sensitivity test when you need fast, practical answers. Keep the experiment lean, focus on RPV and conversion, and treat qualitative feedback as a crucial complement to the numbers. If you want, share details about your product and traffic—I can help you sketch the exact variant and metrics to watch.